Annual reports
As a read through the reports I’m a little unsure what information to focus on. There is 182 pages of company information and financial data. It was a little overwhelming. So, I decided to focus on the highlights over the last two years. The 2018 annual report starts with financial highlights from 2018 and 2017. Even though the report is in Euros I am still hoping to follow the financial trail. It’s a high-level detail of revenue, profit and loss and assets. I’m a little curious how much a Euro dollar converts to an Aussie dollar. The annual reports list group revenue in 2018 was 1,861 million Euro. I find out that one euro equates to 1.63 dollars. Therefore 1,861 million would equate to 3,033M AUD. There was also a similar group revenue of 1,786 Euro in 2017. A slight increase from 2017 to 2018. After learning quite a few ratios in the last semester I could easily identify some of the acronyms the annual report was detailing.
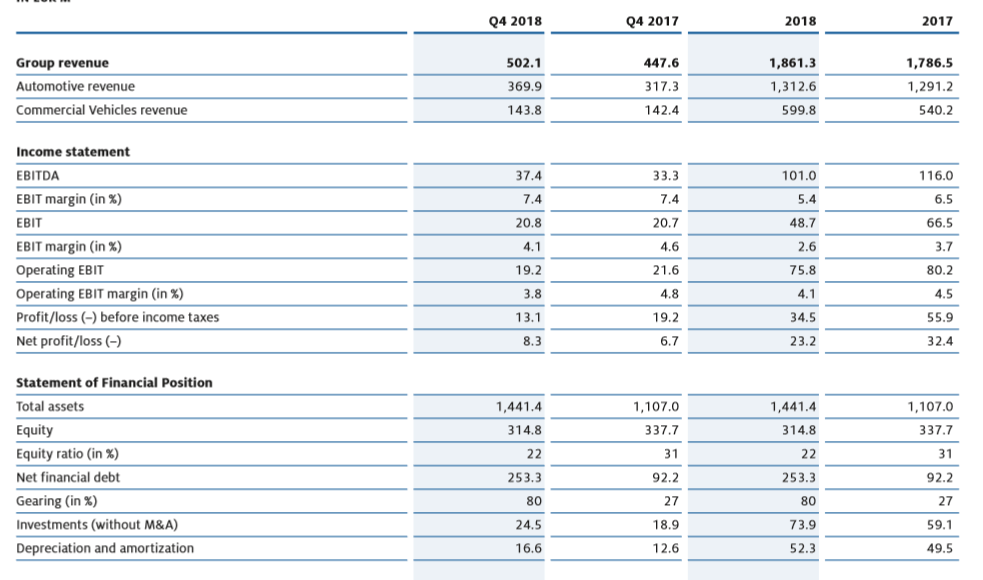
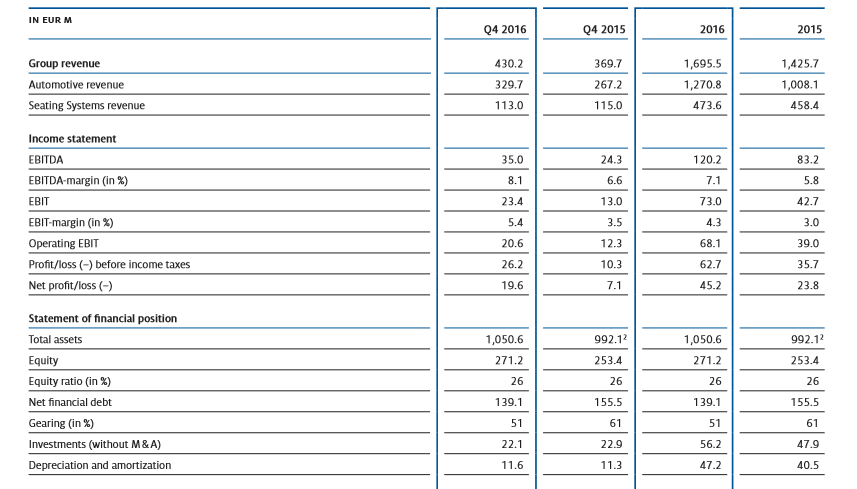
The income statements list earnings before income tax, depreciation and amortization (EBITDA). You can see 2018 have a lower EBITDA of 101M EURO. It then shows the earnings before income tax (EBIT). We did this exercise in the last semester where we separated the financial and operation assets, liabilities, revenue and expenses. After deducting the income tax from the earnings Grammer has an EBIT Margin on 2.6% in 2018 and 3.7% in 2017. The above table also lists the operating earnings before income tax. From an operating perspective Grammer’s operating EBIT is a lot higher at 75 M EURO. In both years Grammer has made an operating profit of 23M EURO in 2018 and 32M EURO in 2017. I’m a little curious what the 2016 and 2015 years invested in retained earnings. From the 2015 and 2016 results below you can see a steady increase in revenue between the four years, however a decrease in net profits. Net assets have increased each year however the financial debt has increased in 2018 which could have contributed to the lower gross margin for 2018.
The share price has also decreased in 2018 after a steady climb from 2015.
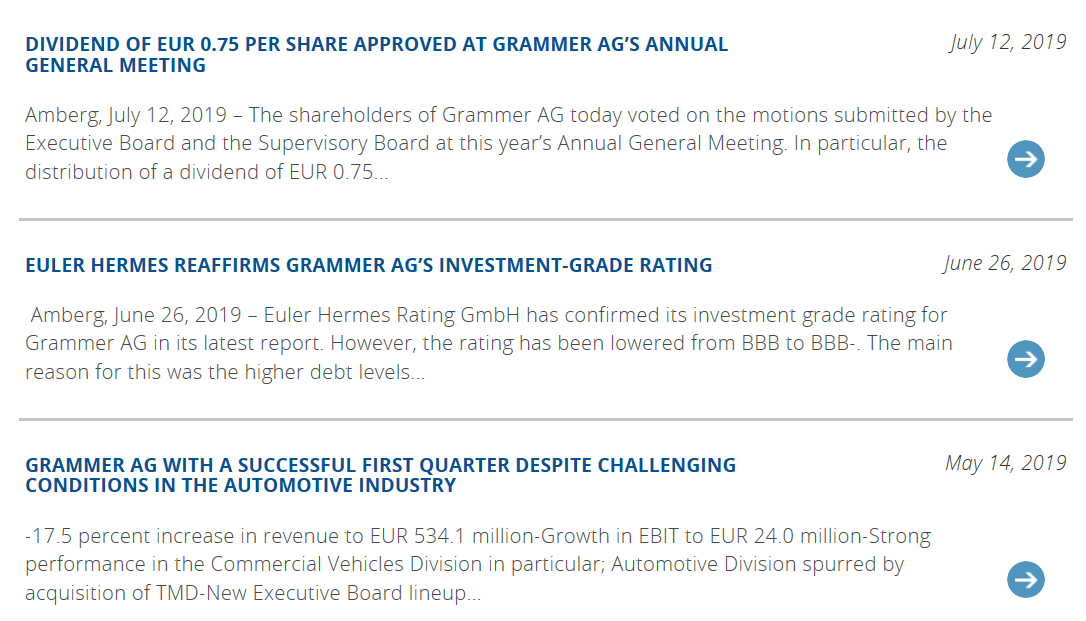
I find these annual reports much more detailed than the company I had last term. I can easily identify the highlights from 2018 and I’m going to suggest the higher debt was from the below acquisition

Some other interesting facts of Grammer as I read through the annual reports
I could continue with 182 pages of information, unfortunately there are other assignments to finish. This is a very impressive company and with 14000 employees in 19 countries worldwide with forty companies I can see why this company has been successful in its endeavor’s. As I continue to discover the financial stability of this company I will endeavor to update through my blog.